This article walks through a typical session with the Austrian national parliament polls. Everything works the same way for every other poll published by POLITICO’s Poll of Polls. The output below was generated with the data published on 2026-10-09.
Reading polls
popGetInfo() lists the available polls. It visits every
country page once and caches the result for a day, so the first call
takes a while.
popRead() downloads a poll. The result is a
popPolls object, a list of data.tables: one
row per poll in $polls, election results in
$elections, party codes, names and colours in
$parties and the trends POLITICO publishes in
$trends.
at = popRead('AT-parliament')
at
#> Austria — National parliament voting intention
#> Retrieved: 2026-10-09 20:07
#>
#> Polls:
#>
#>        date   dateFrom              firm            firmRaw     n  SPOE  OEVP
#>      <Date>     <Date>            <char>             <char> <int> <num> <num>
#>  2013-10-03 2013-10-03            Gallup             Gallup   400  0.28  0.23
#>  2013-10-17 2013-10-17            Gallup             Gallup   400  0.28  0.23
#>  2013-10-20 2013-10-20            Market             Market   603  0.25  0.23
#>  2013-10-25 2013-10-25            Gallup             Gallup   400  0.27  0.24
#>  2013-10-26 2013-10-26          Karmasin           Karmasin   500  0.26  0.23
#>         ---        ---               ---                ---   ---   ---   ---
#>  2026-07-17 2026-07-15              IFDD               IFDD  1000  0.11  0.15
#>  2026-08-25 2026-08-17 Market/Lazarsfeld  Market Lazarsfeld  2000  0.15  0.22
#>  2026-09-01 2026-08-31 Market/Lazarsfeld  Market Lazarsfeld  2000  0.15  0.21
#>  2026-09-08 2026-09-07 Market/Lazarsfeld Market Lazarsfeld   2000  0.14  0.21
#>  2026-09-15 2026-09-14 Market/Lazarsfeld  Market Lazarsfeld  2000  0.16  0.22
#>   FPOE GRUENE    TS  NEOS Jetzt   HCS   MFG  BIER  KPOE
#>  <num>  <num> <num> <num> <num> <num> <num> <num> <num>
#>   0.21   0.13    NA  0.07    NA    NA    NA    NA    NA
#>   0.22   0.13    NA  0.08    NA    NA    NA    NA    NA
#>   0.25   0.12    NA  0.07    NA    NA    NA    NA    NA
#>   0.22   0.13    NA  0.08    NA    NA    NA    NA    NA
#>   0.23   0.12    NA  0.08    NA    NA    NA    NA    NA
#>    ---    ---   ---   ---   ---   ---   ---   ---   ---
#>   0.28   0.10    NA  0.05    NA    NA    NA    NA  0.04
#>   0.38   0.11    NA  0.07    NA    NA    NA    NA  0.03
#>   0.39   0.12    NA  0.07    NA    NA    NA    NA  0.04
#>   0.39   0.13    NA  0.07    NA    NA    NA    NA  0.04
#>   0.37   0.13    NA  0.06    NA    NA    NA    NA  0.04
#>
#> Elections: 2013-09-29 2017-10-15 2019-09-29 2024-09-29
#> Trends: kalmanSmooth, kalman
#> Events: 12
at$parties
#>       code          name   color
#>     <char>        <char>  <char>
#>  1:   SPOE           SPÖ #FF221F
#>  2:   OEVP           ÖVP #63c3d0
#>  3:   FPOE           FPÖ #2F5A8E
#>  4: GRUENE         GRÜNE #88C144
#>  5:     TS Team Stronach #facd50
#>  6:   NEOS          NEOS #F10E69
#>  7:  Jetzt         Jetzt #bbbbbb
#>  8:    HCS            HC #4a9dd9
#>  9:    MFG           MFG #6e706e
#> 10:   BIER          BIER #FFED00
#> 11:   KPOE           KPÖ #aa0000
Shares are stored as fractions (0.27 = 27 %), seat
projections such as NL-parliament as absolute numbers.
Trends
popAddTrend() adds a poll aggregation. The default is a
Kalman filter, which treats the true support of a party as a random walk
and every poll as a noisy measurement of it, weighted by its sample
size. sd is the daily standard deviation of the random
walk: larger values follow the polls more closely.
The filter only looks back in time. With
smoothing = TRUE, every estimate also takes the later polls
into account, which removes the lag behind sudden changes. The estimates
are calculated for the dates with polls;
linearInterpolation turns them into a daily series.
at = popAddTrend(at, name = 'filtered', type = 'kalman', args = list(sd = 0.003))
at = popAddTrend(at, name = 'smoothed', type = 'kalman',
                 args = list(sd = 0.003, smoothing = TRUE),
                 interpolations = list(linearInterpolation = list()))
names(at$trends)
#> [1] "kalmanSmooth" "kalman"       "filtered"     "smoothed"
The smoothed trend is the method behind POLITICO’s own
kalmanSmooth trend:
both = merge(at$trends$smoothed, at$trends$kalmanSmooth, by = c('date', 'party'))
both[, .(days = uniqueN(date), meanAbsDifference = mean(abs(value.x - value.y)))]
#>     days meanAbsDifference
#>    <int>             <num>
#> 1:  4735      0.0005200412
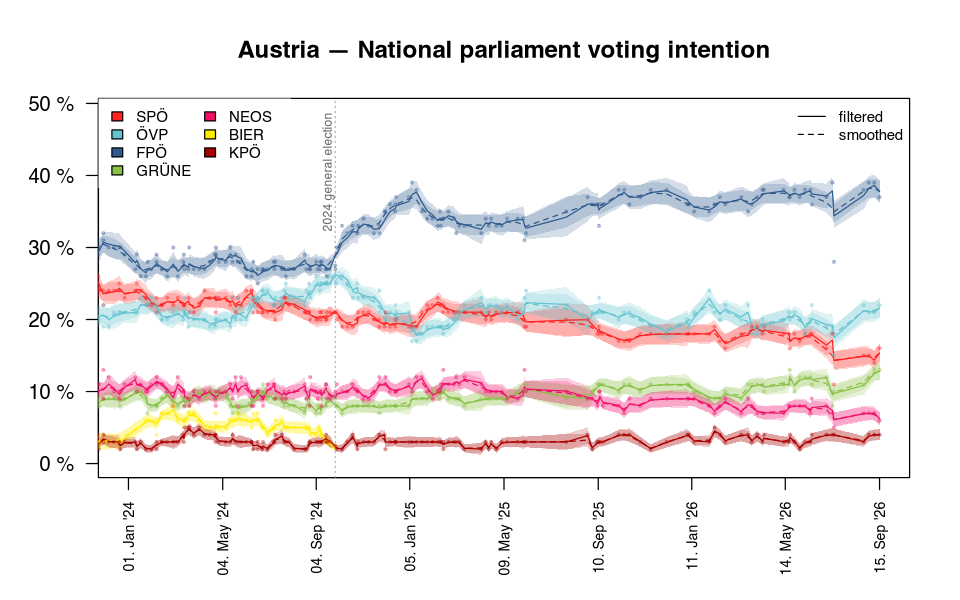
plot() draws the polls as points and every trend as a
line. Trends with a variance, such as the Kalman trends, come with a 95
% uncertainty band. Dotted lines mark the events POLITICO notes in its
charts, such as elections.
plot of chunk unnamed-chunk-7
ggplot2
autoplot() draws the same with ggplot2 and returns an
ordinary ggplot object, so layers, scales and themes can be added as
usual.
library(ggplot2)

at$trends$filtered = NULL
autoplot(at, xlim = c('2024-01-01', NA), level = 0.9) +
    theme_minimal() +
    theme(legend.position = 'bottom')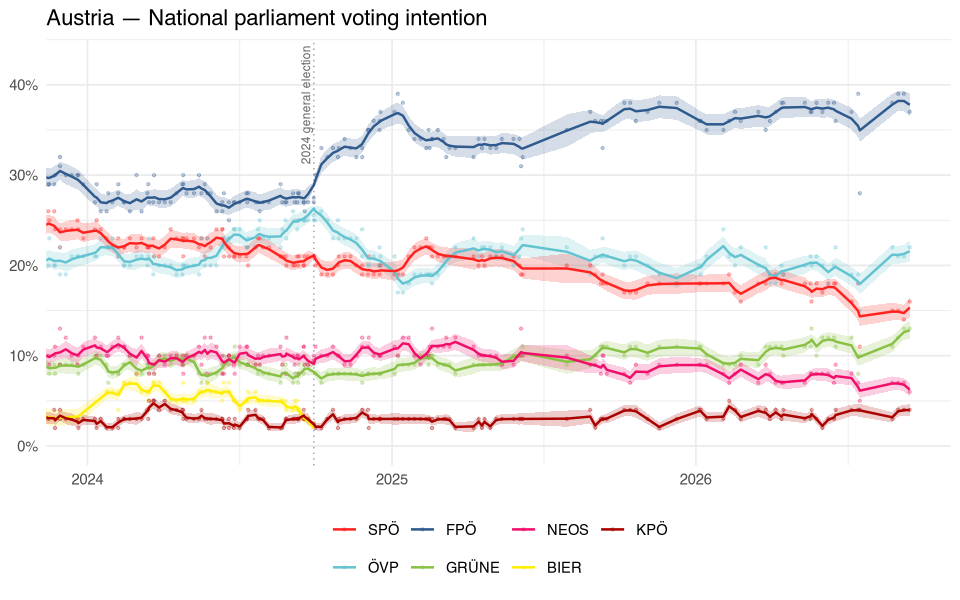
plot of chunk unnamed-chunk-8
For anything else, popLong() returns polls, election
results and trends in long format:
popLong(at)
popLong(at, 'trends')
#>           trend       date  party      value     variance
#>          <char>     <Date> <char>      <num>        <num>
#>     1: smoothed 2013-09-29   SPOE 0.26820000 0.000000e+00
#>     2: smoothed 2013-09-29   OEVP 0.23990000 0.000000e+00
#>     3: smoothed 2013-09-29   FPOE 0.20510000 0.000000e+00
#>     4: smoothed 2013-09-29 GRUENE 0.12420000 0.000000e+00
#>     5: smoothed 2013-09-29     TS 0.05730000 0.000000e+00
#>    ---
#> 28541: smoothed 2026-09-15   OEVP 0.21578371 4.840253e-05
#> 28542: smoothed 2026-09-15   FPOE 0.37785585 6.035729e-05
#> 28543: smoothed 2026-09-15 GRUENE 0.12816831 3.597781e-05
#> 28544: smoothed 2026-09-15   NEOS 0.06244160 2.127859e-05
#> 28545: smoothed 2026-09-15   KPOE 0.03992564 1.542379e-05
Current standings, seats and coalitions
popLatest() summarises a trend (by default the one added
last) at a date: the estimated support, its uncertainty, the change over
the last 30 days and the result of the last election.
popLatest(at)
#>     party   name       date      value      lower      upper       change
#>    <char> <char>     <Date>      <num>      <num>      <num>        <num>
#> 1:   FPOE    FPÖ 2026-09-15 0.37785585 0.36262890 0.39308280  0.006349343
#> 2:   OEVP    ÖVP 2026-09-15 0.21578371 0.20214787 0.22941956  0.011448049
#> 3:   SPOE    SPÖ 2026-09-15 0.15342759 0.14097285 0.16588234  0.005771269
#> 4: GRUENE  GRÜNE 2026-09-15 0.12816831 0.11641215 0.13992447  0.018329771
#> 5:   NEOS   NEOS 2026-09-15 0.06244160 0.05340054 0.07148267 -0.004984389
#> 6:   KPOE    KPÖ 2026-09-15 0.03992564 0.03222825 0.04762304  0.006330997
#>    election
#>       <num>
#> 1:    0.289
#> 2:    0.263
#> 3:    0.211
#> 4:    0.082
#> 5:    0.091
#> 6:    0.024
popSeats() converts these shares into seats. The
Austrian Nationalrat has 183 seats, a 4 % threshold and allocates the
remaining seats on the federal level with the D’Hondt method, which a
national projection approximates well:
popSeats(at, seats = 183, threshold = 0.04, method = 'dhondt')
#>     party   name      share seats
#>    <char> <char>      <num> <int>
#> 1:   FPOE    FPÖ 0.37785585    74
#> 2:   OEVP    ÖVP 0.21578371    42
#> 3:   SPOE    SPÖ 0.15342759    30
#> 4: GRUENE  GRÜNE 0.12816831    25
#> 5:   NEOS   NEOS 0.06244160    12
#> 6:   KPOE    KPÖ 0.03992564     0
The trend is uncertain, and so are the seats. With
simulations, the shares are drawn from the uncertainty of
the trend: lower and upper give the range of
seats in 90 % of the simulations, pSeats the probability
that a party passes the threshold.
set.seed(1)
popSeats(at, seats = 183, threshold = 0.04, method = 'dhondt', simulations = 2000)
#>     party   name      share seats lower upper pSeats
#>    <char> <char>      <num> <int> <int> <int>  <num>
#> 1:   FPOE    FPÖ 0.37785585    74    69    76  1.000
#> 2:   OEVP    ÖVP 0.21578371    42    39    44  1.000
#> 3:   SPOE    SPÖ 0.15342759    30    27    31  1.000
#> 4: GRUENE  GRÜNE 0.12816831    25    22    26  1.000
#> 5:   NEOS   NEOS 0.06244160    12    10    13  1.000
#> 6:   KPOE    KPÖ 0.03992564     0     0     8  0.488
popCoalitions() adds up the simulated seats of
coalitions and gives the probability of a majority, either for given
coalitions or for every plausible combination of up to three
parties:
popCoalitions(at, seats = 183, threshold = 0.04,
              coalitions = list('ÖVP-SPÖ-NEOS' = c('OEVP', 'SPOE', 'NEOS'),
                                'FPÖ-ÖVP' = c('FPOE', 'OEVP')))
#>       coalition        parties seats lower upper pMajority
#>          <char>         <char> <int> <int> <int>     <num>
#> 1: ÖVP-SPÖ-NEOS OEVP+SPOE+NEOS    84    79    86         0
#> 2:      FPÖ-ÖVP      FPOE+OEVP   116   110   118         1
popCoalitions(at, seats = 183, threshold = 0.04)
#>           coalition          parties seats lower upper pMajority
#>              <char>           <char> <int> <int> <int>     <num>
#> 1:        FPOE+OEVP        FPOE+OEVP   116   110   118    1.0000
#> 2:        FPOE+SPOE        FPOE+SPOE   104    98   106    1.0000
#> 3:      FPOE+GRUENE      FPOE+GRUENE    99    93   101    0.9960
#> 4: OEVP+SPOE+GRUENE OEVP+SPOE+GRUENE    97    91    99    0.9225
#> 5:   FPOE+NEOS+KPOE   FPOE+NEOS+KPOE    86    84    92    0.0775
Polling firms
popFirms() lists the firms behind the polls. Spellings
that only differ in case, accents, punctuation or white space are merged
when the data is read; spellings shows under which names a
firm is published:
popFirms(at)[, .(firm, polls, last, spellings)]
#>                               firm polls       last
#>                             <char> <int>     <Date>
#>  1:               Research Affairs   162 2021-09-30
#>  2:                Unique Research   139 2026-06-18
#>  3:              Market/Lazarsfeld   138 2026-09-15
#>  4:                         Market    97 2025-07-30
#>  5:                         Gallup    81 2016-12-10
#>  6:                            OGM    58 2026-05-20
#>  7: Market/Lazarsfeld Gesellschaft    34 2024-04-29
#>  8:                           IFDD    32 2026-07-17
#>  9:                    Peter Hajek    23 2024-02-29
#> 10:                           IMAS    20 2018-05-09
#> 11:                          Hajek    18 2018-10-31
#> 12:                        Spectra     9 2025-02-14
#> 13:                       Karmasin     8 2020-01-15
#> 14:                meinungsraum.at     7 2017-05-14
#> 15:                       AKonsult     5 2017-08-04
#> 16:                 Demox Research     5 2019-09-14
#> 17:                            GfK     5 2018-12-09
#> 18:                           IFES     3 2017-07-04
#> 19:                           INSA     3 2026-07-15
#> 20:                           SORA     2 2019-06-10
#> 21:                        cmatzka     2 2017-09-22
#> 22:                 IFES (for SPÖ)     1 2019-07-10
#> 23:              Market-Lazarsfelt     1 2024-03-27
#> 24:    Unique Research/Peter Hajek     1 2023-06-29
#>                               firm polls       last
#>                             <char> <int>     <Date>
#>                                                     spellings
#>                                                        <char>
#>  1:                                          Research Affairs
#>  2:                         Unique Research | Unique research
#>  3: Market/Lazarsfeld | Market Lazarsfeld | Market-Lazarsfeld
#>  4:                                                    Market
#>  5:                                                    Gallup
#>  6:                                                 OGM | ogm
#>  7:                            Market/Lazarsfeld Gesellschaft
#>  8:                                                      IFDD
#>  9:                                               Peter Hajek
#> 10:                                                      IMAS
#> 11:                                                     Hajek
#> 12:                                                   Spectra
#> 13:                                                  Karmasin
#> 14:                                           meinungsraum.at
#> 15:                                                  AKonsult
#> 16:                                            Demox Research
#> 17:                                                       GfK
#> 18:                                                      IFES
#> 19:                                                      INSA
#> 20:                                                      SORA
#> 21:                                                   cmatzka
#> 22:                                            IFES (for SPÖ)
#> 23:                                         Market-Lazarsfelt
#> 24:                               Unique Research/Peter Hajek
#>                                                     spellings
#>                                                        <char>
Anything beyond that needs knowledge about the firms and is left to
popRenameFirms(), e.g. to merge a typo or a firm published
with and without the first name of its founder:
at = popRenameFirms(at, c('Peter Hajek' = 'Hajek', 'Market-Lazarsfelt' = 'Market-Lazarsfeld'))popHouseEffects() estimates how much each firm deviates
from the average firm for each party. Trend and effects are estimated
together, so a firm that publishes many polls cannot pull the trend
towards itself. As the effects are assumed to be constant, only the
polls since the last election are used here:
recent = at
recent$polls = at$polls[date > as.Date('2024-09-29')]
effects = popHouseEffects(recent, minPolls = 10)
# percentage points, one row per firm
effects[, effect := round(100*effect, 1)]
dcast(effects, firm ~ party, value.var = 'effect')
#> Key: <firm>
#>                 firm  FPOE GRUENE  KPOE  NEOS  OEVP  SPOE
#>               <char> <num>  <num> <num> <num> <num> <num>
#> 1: Market-Lazarsfeld     0      0     0     0     0     0
With houseEffects = TRUE, popAddTrend()
corrects the polls by these effects before calculating the trend:
recent = popAddTrend(recent, name = 'corrected', type = 'kalman',
                     args = list(smoothing = TRUE),
                     interpolations = list(linearInterpolation = list()),
                     houseEffects = TRUE)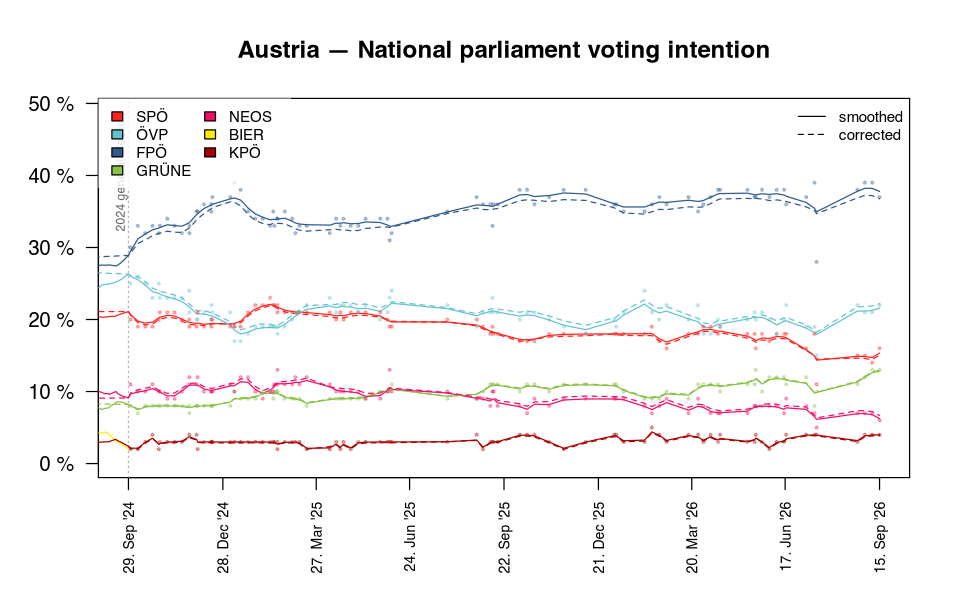
plot of chunk unnamed-chunk-18
Accuracy at past elections
How good are these trends? popAccuracy() goes back to
every election in the data, calculates the trends from the polls
published before it and compares them with the result. The last poll of
every firm is evaluated as well.
accuracy = popAccuracy(at, trends = list(
    'kalman' = list(type = 'kalman'),
    'kalman, corrected' = list(type = 'kalman', houseEffects = TRUE),
    'mean of 30 days' = list(type = 'weightedMeanLastDays')
))
# mean absolute error per party, in percentage points
accuracy[, .(elections = uniqueN(election), mae = round(100*mean(abs(error)), 2)),
         by = .(kind, source)][order(mae)]
#>       kind            source elections   mae
#>     <char>            <char>     <int> <num>
#>  1:   firm           cmatzka         1  0.58
#>  2:   firm              IFDD         1  0.83
#>  3:   firm               OGM         3  1.13
#>  4:   firm   Unique Research         3  1.20
#>  5:  trend            kalman         3  1.21
#>  6:  trend kalman, corrected         3  1.23
#>  7:  trend   mean of 30 days         3  1.26
#>  8:   firm Market-Lazarsfeld         1  1.29
#>  9:   firm             Hajek         1  1.52
#> 10:   firm            Market         3  1.53
#> 11:   firm           Spectra         2  1.58
#> 12:   firm          Karmasin         1  1.78
#> 13:   firm  Research Affairs         2  1.83
#> 14:   firm    Demox Research         1  2.50
Custom trends
popAddTrend() also takes a function. It gets the
popPolls object as data and returns a long
table with the columns date, party and
value (and optionally variance). For example,
the median of the polls of the last few weeks:
rollingMedian = function(data, days = 21) {
    polls = popLong(data)[date >= as.Date('2024-01-01')]
    dates = seq(min(polls$date), max(polls$date), by = 'week')
    polls[, .(date = dates,
              value = vapply(dates, function(d) median(value[date > d - days & date <= d]),
                             numeric(1))),
          by = party]
}

at = popAddTrend(at, type = rollingMedian, args = list(days = 28))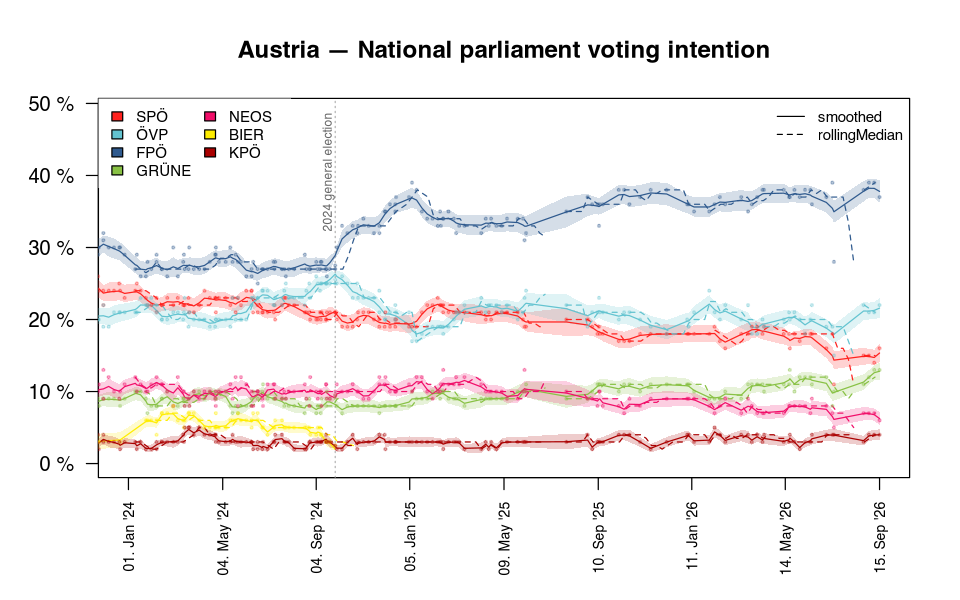
plot of chunk unnamed-chunk-21
Working offline
popDownload() saves the data of several polls as
published, and popRead(dir = ...) reads it back without
sending a request:
popDownload('polls', codes = c('AT-parliament', 'DE-parliament'))
de = popRead('DE-parliament', dir = 'polls')
Within a session, options(pollofpolls.dataMaxAge = 3600)
keeps downloaded data for an hour instead of fetching it again on every
popRead().